

A practical enterprise guide to interpreting carrier infrastructure maps, assessing serviceability, and verifying global network reach.
A global Internet service provider presents a polished map: colored lines span continents, dozens of dots mark major cities, and transatlantic connections appear to link North America and Europe directly. For an enterprise planning connectivity for offices in Boston, Frankfurt, Singapore, and São Paulo, the map looks reassuring. It may even appear to settle the question of which carrier has the strongest global network.
But what, precisely, does the map prove? Does a dot mean the provider can connect a particular building? Does a line show owned fiber, leased wavelengths, an IP relationship, or merely an illustrative corridor? Can two apparent routes survive the same cable cut? And will traffic between a branch and its cloud applications follow anything resembling the route drawn on the page?
These questions matter because a network map is useful evidence, but incomplete evidence. The backbone capabilities of the leading global Tier 1 ISPs are important when evaluating international connectivity. Yet even an extensive Tier 1 network requires appropriate access arrangements, interconnection, routing policy, and service design to deliver a successful enterprise solution. A provider can have an impressive global footprint and still be poorly suited to an individual set of locations.
This guide explains how to read ISP network maps as an experienced network architect or carrier-sourcing professional would: start with the legend, identify what layer of the network is depicted, examine the points of presence and backbone, distinguish actual infrastructure from commercial service reach, and validate the claims against the needs of the business. Throughout, the critical distinction is between where a carrier appears to be present and what it can demonstrably deliver.


What Is an ISP Network Map?
An ISP network map is a geographic or logical representation of an Internet service provider’s network, often showing points of presence (POPs), long-haul backbone connections, interconnection locations, terrestrial or submarine links, and sometimes the cities or buildings where particular services are available. An ISP backbone map typically emphasizes the provider’s major hubs and links; an access-network map focuses more on metropolitan facilities and customer reach.
The difficulty is that a map can represent several different things without making the distinction obvious. Some diagrams depict physical routes; others depict network topology as engineers understand it at the IP layer. Some are marketing illustrations of a provider’s global footprint rather than engineering drawings. An interactive coverage map may combine facilities-based network infrastructure with locations served by wholesale access partners. None of these approaches is inherently misleading if explained accurately. Problems arise when buyers infer more from the map than its symbols or disclaimers support.
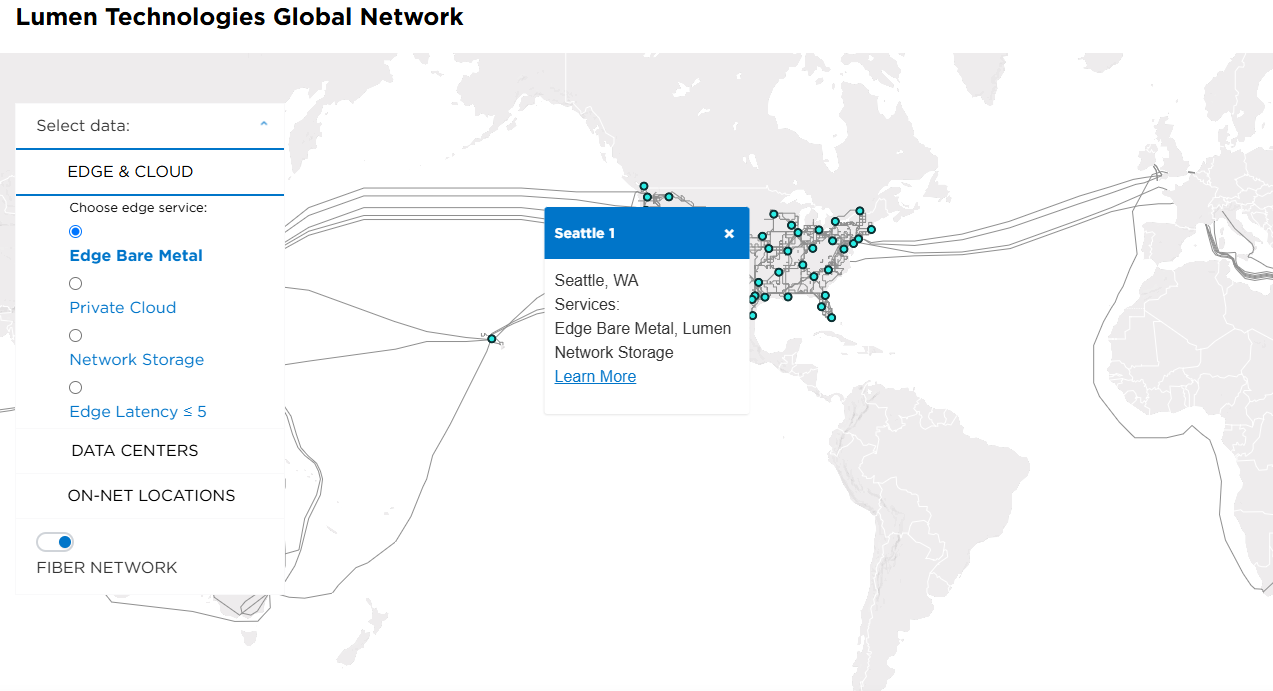
For example, Lumen’s official network-maps page explicitly notes that its global network includes owned, leased-access, and indefeasible-right-of-use (IRU) segments that are not distinguished on its maps; it also says regional carriers provide services in some markets. That qualification reveals why a line and a city marker cannot be equated with end-to-end ownership or uniform operational control.
A network map is most valuable when treated as a starting point for technical due diligence rather than as a substitute for a qualified service design, engineering route information, or an address-specific quotation.
Understand the Type of Map Before Reading Its Symbols
The first question is not where the network goes. It is what kind of network the diagram is showing. A major carrier may operate an IP transit backbone, optical transport infrastructure, metro access networks, data-center interconnections, and managed services over the same geography. These layers overlap, but they are not interchangeable.
A physical fiber map describes routes or corridors where fiber infrastructure exists. An optical or wavelengths map describes the transmission network on which capacity can be provisioned. An IP backbone map represents routers and logical IP links between them; several such links may share underlying optical transport, while one IP connection can traverse multiple physical segments. A POP map emphasizes equipment presence or available interfaces. A commercial coverage map may depict every market where the carrier can arrange service through partners, even where its own backbone does not extend.
| Type of map | What it can help establish | What it cannot establish alone |
| Global IP backbone | Major IP hubs, logical backbone reach, apparent intercity connectivity | Exact fiber routes, actual packet paths, building availability |
| Long-haul fiber | Physical corridors or route-mile footprint, when specifically represented | IP routing policy, product capacity at a given site |
| Optical/wavelength | Optical nodes, enabled markets, optical transport routes | Availability of equivalent DIA or IP transit everywhere |
| POP/interconnection | Facilities or cities with carrier network equipment | On-net service in nearby buildings; live peering with every colocated network |
| Service-availability | Markets or addresses potentially eligible for a product | Ownership, cost, lead time, or physical route independence |
| Cloud-connectivity | Interconnection facilities or cloud on-ramp access points | Access to every region, latency guarantees, or cloud application performance |
These distinctions explain why carrier map comparisons require more work than simply counting lines or dots. CAIDA’s Internet topology research distinguishes different representations of network topology, including AS-level and router-level views. A geographic backbone drawing adds still another layer of abstraction. A physical route, an IP hop, and an autonomous-system relationship answer fundamentally different questions.
This article therefore uses network map as the broad term and identifies the specific layer whenever an engineering conclusion depends on it. Readers looking for a more detailed explanation of how the global backbone carries Internet traffic can also consult Macronet Services’ Internet Backbone Explained guide.
How to Read an ISP Network Map: The Six-Step Method
A useful review can begin in minutes, provided the reviewer approaches the map systematically. The following six steps form the Macronet Services ISP Network Map Review Method. The goal is not to turn an illustration into engineering proof, but to identify the right questions and determine what additional evidence is needed.
Step 1 — Identify the product and network layer. Determine whether the map concerns Internet transit, dedicated Internet access, wavelengths, dark fiber, Ethernet, cloud connectivity, or broader service coverage. A map produced for a wavelengths product should not be assumed to represent the availability of BGP transit or an Ethernet local loop. If the provider offers filters, make sure the correct one is selected.
Step 2 — Read the legend, date, and qualifications. Look for distinct symbols for core and access POPs, multiple POP locations, owned and leased routes, submarine cables, construction under way, and service-enabled markets. Pay attention to whether the line indicates a route, a logical link, or a schematic connection. Published maps are snapshots. A point or circuit shown in an archived map may have been relocated, upgraded, or retired.
Step 3 — Find the POPs relevant to your enterprise. Mark the customer’s facilities, data centers, cloud interconnection points, and major concentrations of users. Look for network presence in the right metropolitan areas, but do not conclude that proximity means the building is serviceable. A carrier may have an IP router nearby while relying on a different company to deliver the final access circuit.
Step 4 — Examine the backbone and regional dependencies. Trace the apparent connections among your target markets. Notice where routes converge on a limited number of hubs, where a subsea segment is required, and whether the map distinguishes parallel intercity corridors. A single visible link may carry enormous capacity, but its existence does not establish route diversity or latency.
Step 5 — Separate facilities-based reach from extended service reach. Seek the provider’s definitions of owned facilities, leased transport, IRUs, local access partners, on-net buildings, and off-net service. A carrier may provide reliable service in a city without owning a fiber route into it. That may be commercially sensible, but it changes the delivery chain and the evidence needed to evaluate a proposal.
Step 6 — Validate the actual service requirement. Supply exact addresses, required bandwidth, handoff interfaces, preferred service features, implementation deadlines, and resiliency objectives. Request the provider’s site qualification, design assumptions, delivery ownership, performance commitments, and any available route-diversity evidence. If the carrier cannot confirm a requirement, record it as unverified rather than assuming it is satisfied.
The same six questions apply to regional fiber operators and multinational backbones, although the evidence needed will differ by product. For mission-critical services, keep a brief record of each material map claim, the source and date, and whether it has been independently verified or confirmed by the carrier.

ISP Network Map Legend: A Practical Decoding Reference
There is no universal symbol standard across ISP maps. The examples below are common visual conventions, not fixed definitions; always use the publisher’s own legend before assigning meaning.
| Map marking or label | Common interpretation | What to verify |
| Filled city dot / POP marker | Carrier equipment or service presence in the metro area | Actual facility, router or optical role, and supported products |
| Multiple-dot / stacked POP symbol | More than one reported POP in a market | Separate addresses, equipment, entrances and failure domains |
| Solid intercity line | Backbone or fiber corridor, depending on the map layer | Physical route versus logical link; owned versus leased transport |
| Dashed or differently colored line | Planned, leased, partner-delivered or alternate route | Publisher-specific legend and whether the connection is in service |
| Ring or loop | Multiple apparent links or an intended restoration topology | Actual paths, switching behavior and shared infrastructure |
| Cable landing / subsea symbol | International cable or coastal landing connectivity | Cable system, landing facilities and onward terrestrial backhaul |
| Cloud or data-center icon | Interconnection option or participating facility | Product availability, handoff, cloud region and booking requirements |
For example, two POP markers in Frankfurt might indicate two equipment locations, but not two independent routes into a customer’s building. Similarly, a dashed transatlantic line may mean a leased transport segment on one map and a planned route on another. The legend is an instruction for asking the next question—not proof of the answer.
What Does POP Mean on an ISP Network Map?
A point of presence, or POP, is a physical location where a network provider maintains equipment or interfaces to deliver services or connect with other networks. POPs may be housed in carrier hotels, data centers, telecommunications facilities, or dedicated sites. Depending on their function, they may contain core IP routers, access or aggregation routers, optical transport equipment, cross-connects, and supporting network infrastructure.
A POP symbol does not necessarily specify which of those systems are present. Nor does it mean the carrier has direct fiber into every business building nearby. Consider an ISP that operates a major router in a downtown data center. The carrier may be able to deliver IP transit to a customer colocated in the same facility using a relatively simple cross-connect. Connecting an office seven miles away might instead require an Ethernet local access circuit, a construction extension, or a regional wholesale partner.
Different carriers use different POP classifications. A core POP typically supports major backbone aggregation and high-capacity network connectivity. An access POP may be oriented toward customer handoffs, metro aggregation, or reaching a broader area. A peering or interconnection POP is a location with equipment or connectivity relevant to exchanging traffic with other networks. These roles can coexist, and the labels are not universally standardized.
This becomes especially visible in Zayo’s July 2024 network mapbook, which distinguishes Core POPs, Access POPs, Core Network, Access Network, and cable landing stations. These labels help buyers understand the infrastructure layer before asking whether a particular facility supports their required service; the archived mapbook should not be treated as a live inventory.
Another distinction matters: a POP is not the same as an Internet exchange point (IXP). A network may colocate at a facility that also hosts an exchange and choose to participate in that exchange, establish private interconnections, or use transit without participating in either arrangement. A map marking a common building proves neither that two carriers are peers nor that their traffic will travel directly between them.
A nearby POP can reduce transport requirements or broaden interconnection choices, but geography alone does not settle cost, latency, or resilience. The serving access circuit and routing architecture still determine the outcome.
How to Interpret Backbone Routes, Fiber Lines, and Capacity Labels
Lines connecting cities are the most visually persuasive feature of a carrier map, and among the easiest to misunderstand. On a schematic IP backbone map, a line might represent a backbone relationship between routers in Chicago and New York. It does not necessarily mean those routers are connected by one unbroken fiber cable following the illustrated shape. The link could be supported by optical transport equipment, leased wavelengths, intermediate regeneration sites, or multiple underlying circuits.
On a fiber map, line placement may describe the route corridor more directly. Even then, public versions often simplify geometry for readability. The map may omit lateral connections, splice points, conduit arrangements, and intermediate facilities. A route line becomes more useful when the publisher defines its meaning, identifies ownership distinctions, and provides engineering evidence for particular questions.
Long-haul and metro networks also serve different functions. A carrier can own substantial long-haul routes between regional hubs but use third-party access networks to reach customer buildings. Conversely, a regional carrier can own extensive metro fiber in a city but depend on other networks for international IP connectivity. Both can sell enterprise Internet services; they simply have different underlying assets and cost structures.
Capacity indicators require the same discipline. Labels such as 100G, 400G, or 800G may refer to optical wavelengths, router interface capabilities, backbone upgrades, or aggregate network design. They are not equivalent to guaranteed spare capacity for a customer at a specific building. A 400G-enabled optical route is not a promise that a 400 Gbps DIA handoff can be ordered at every POP on the map. Ask which service is enabled, the available port types, the capacity actually available, and how that capacity is protected.
Network-size statistics are also easy to compare incorrectly. Route miles generally describe the geographic length of a network corridor; fiber miles can multiply the underlying distance by the number of individual strands. Neither measure, considered alone, is a reliable proxy for geographic diversity, capacity available to an enterprise, or the quality of an ISP’s routing relationships. Use those metrics to understand scale, not to score site-specific service suitability.
Owned, Leased, and IRU Fiber: What the Map May Not Disclose
Telecommunications infrastructure is built through a mix of ownership, long-term use rights, leases, and supplier relationships. A global ISP may own backbone routes in major regions, lease wavelengths across others, acquire indefeasible rights of use (IRUs) on specific fiber segments, and purchase regional access where it does not own a local network. This is normal industry practice, not an automatic sign of inferior service.
The distinction matters because it affects operational control, maintenance coordination, commercial dependency, restoration processes, and the ability to substantiate route diversity. Ownership of fiber infrastructure is different from ownership of equipment operating on that fiber. A company can control its IP routing and customer-facing service while relying on another operator for the terrestrial transport beneath it.
Lumen’s publicly stated map qualifications illustrate why the buyer should not assume that every visible link represents an identical asset relationship. The company explicitly groups owned, leased-access, and IRU segments on maps and notes the use of in-region providers in some markets. Such disclosures are valuable because they tell readers where the public illustration ends and the need for service-level verification begins.
The practical procurement question is not simply, “Do you own the network?” A better discussion asks which portions of the proposed service are directly operated by the carrier, what transport or local-loop suppliers are involved, where handoffs occur, who manages faults, and whether the design includes known single points of failure. In many cases, a well-managed leased segment is preferable to an owned route that does not meet the enterprise’s location or performance requirements.
For an individual circuit, request a scope-specific delivery-chain description: the serving facility, local-loop provider, network-to-network interface (NNI) where applicable, operational demarcation, and material transport dependencies. Even when detailed route geometry is confidential, carriers can often explain who owns and repairs each segment.
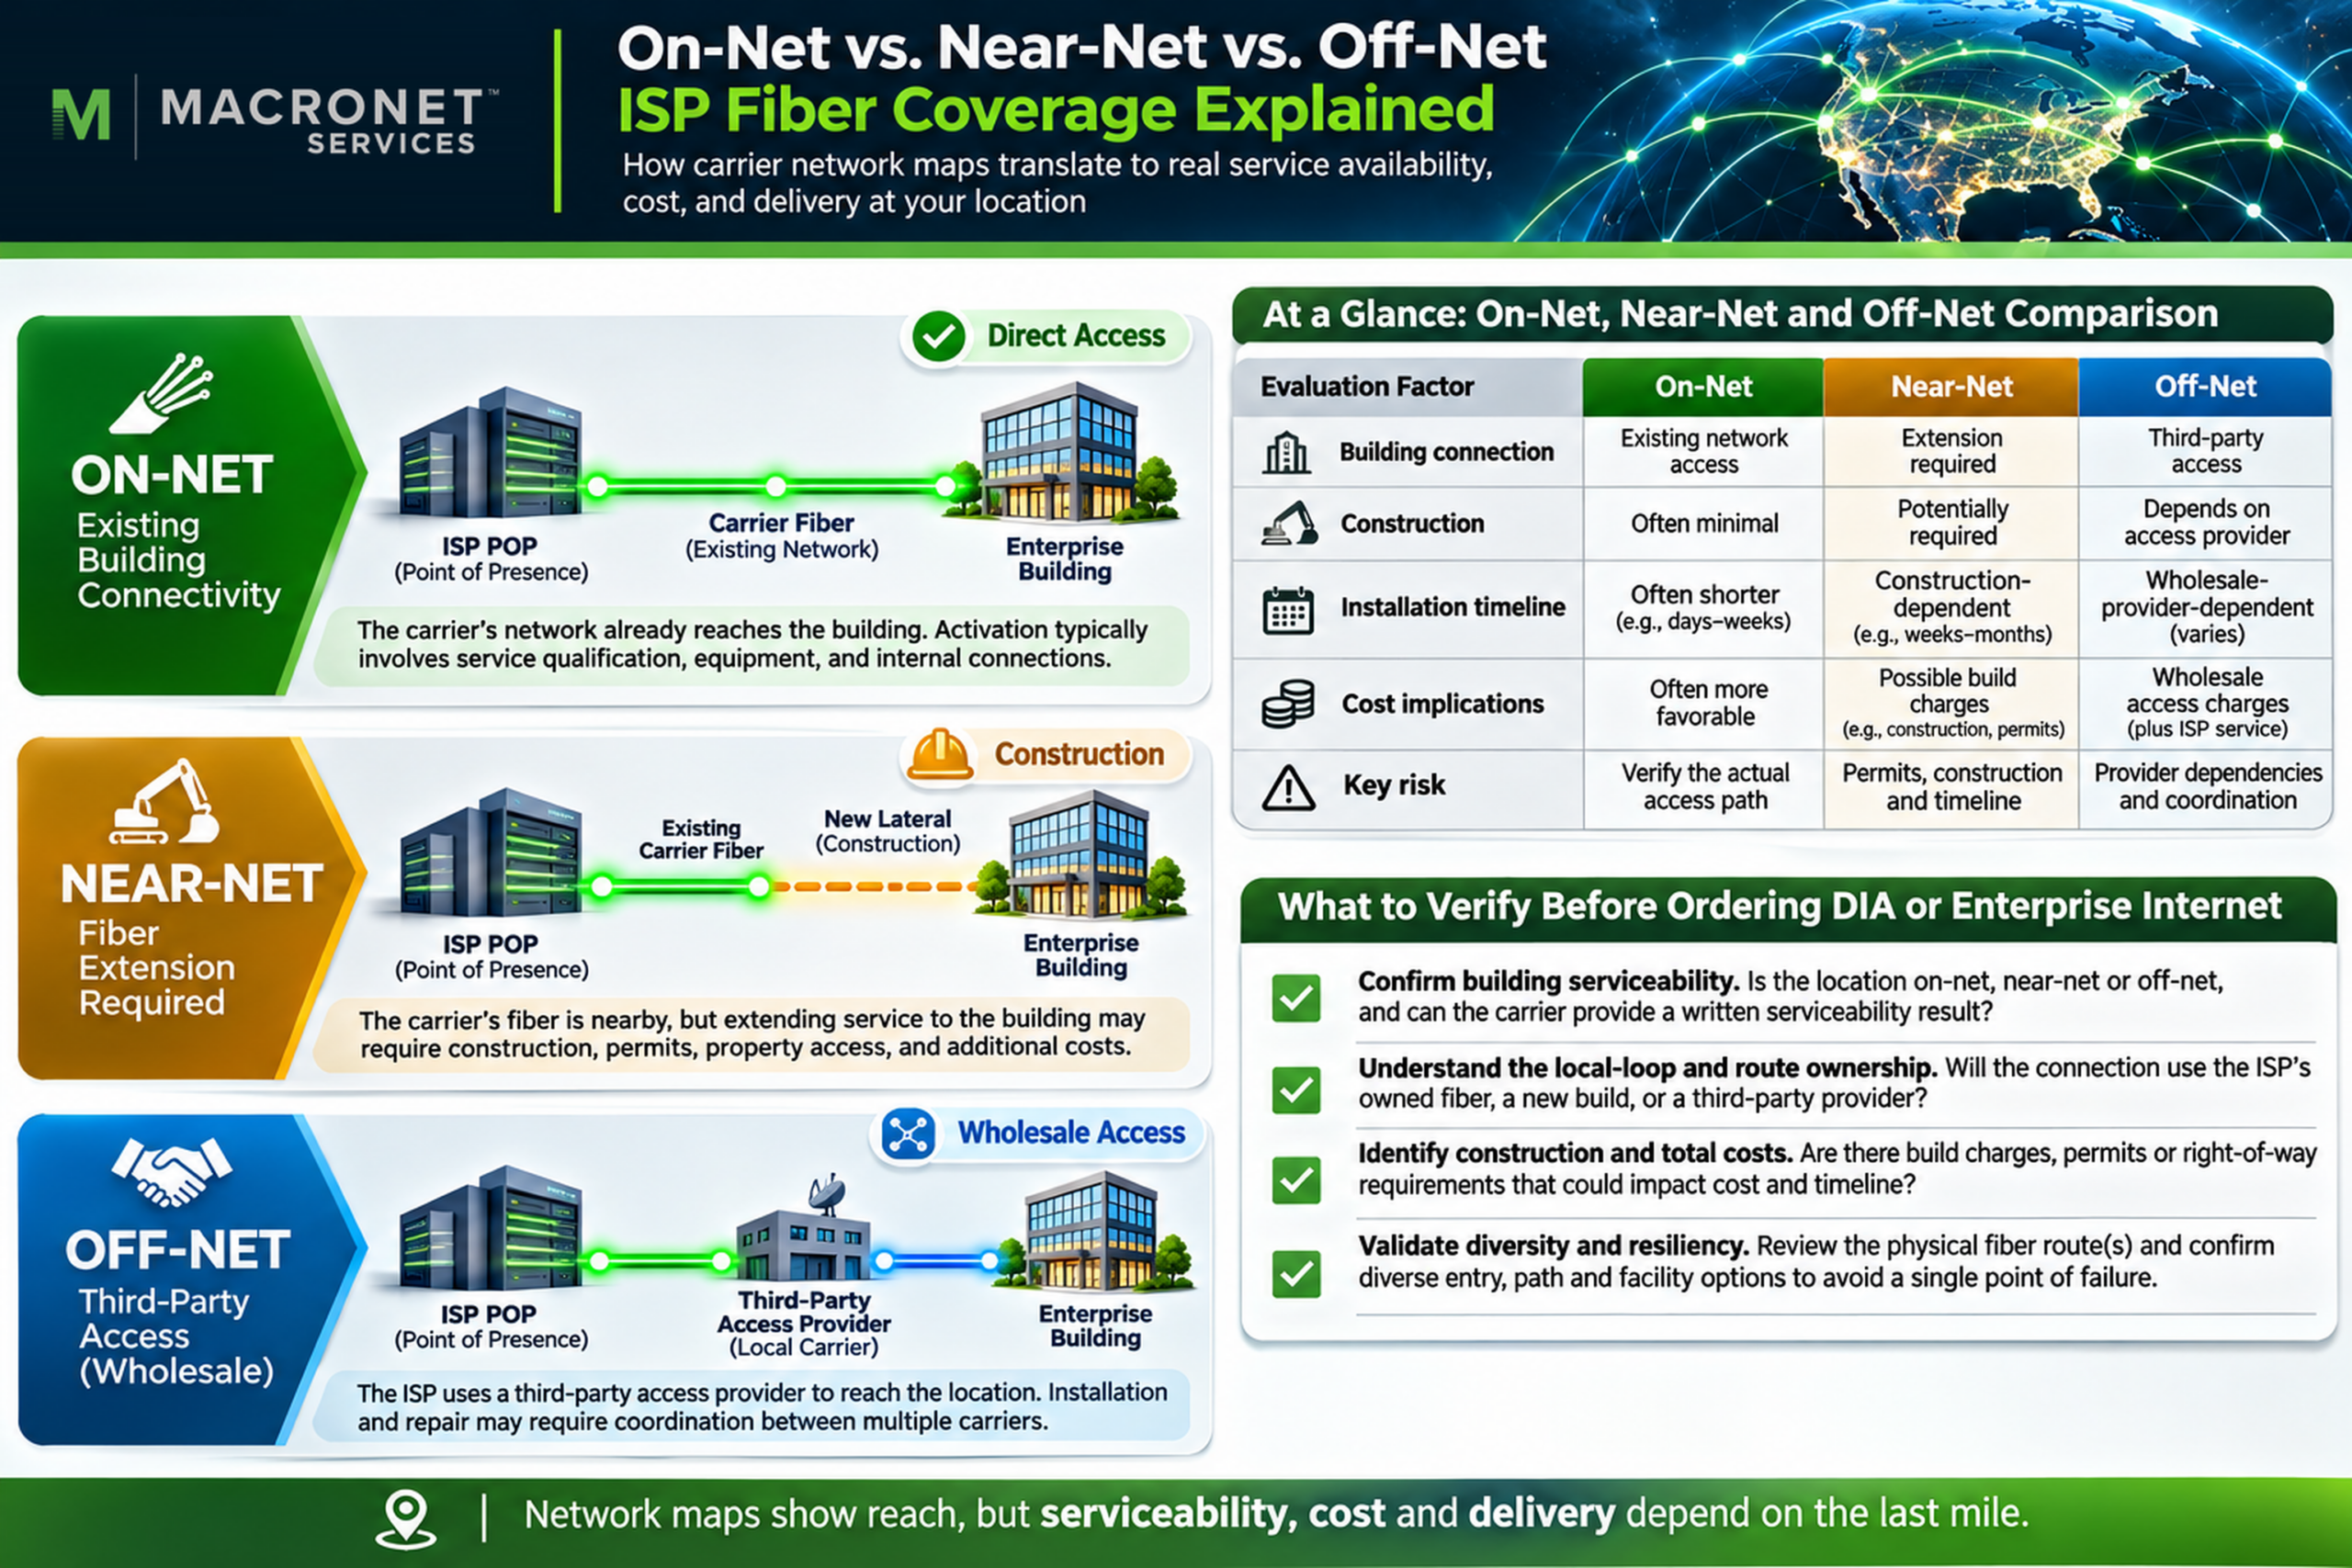
On-Net, Near-Net, and Off-Net: Does the ISP Reach Your Building?
A common mistake is to interpret a carrier’s network presence in a city as proof of service availability at a street address. The distinction between on-net, near-net, and off-net is among the most commercially important lessons in reading a network map.
An on-net building generally has existing infrastructure belonging to or directly served by the carrier, although the exact definition varies. The building may already have the required entrance facilities or an established connection to the provider. That often reduces installation complexity, but it does not guarantee that the desired product, interface, speed, or diversity is available without additional work.
A near-net building lies close to relevant network infrastructure but may require a lateral fiber extension, construction, building permissions, or additional equipment. A line crossing the nearby street is not the same as a completed, approved path into the customer’s telecommunications room. The construction scope may significantly affect installation time and nonrecurring cost.
An off-net building can still receive service from a national or global ISP, but the selling provider may need to purchase local access from another network operator. The customer receives the contracted Internet service from the retail ISP while part of the physical delivery depends on a wholesale supplier. A carrier may quote a highly competitive off-net circuit because it has strong relationships with regional access providers. Conversely, a nominally on-net service can be expensive if existing equipment must be upgraded.
| Delivery classification | What it typically suggests | What to verify before selecting the provider |
| On-net | Existing carrier presence at the facility or an existing connected building | Product-specific bandwidth, port, cross-connect, construction and diversity |
| Near-net | Carrier facilities nearby; extension may be required | Actual build path, permits, schedule, one-time charges and route separation |
| Off-net | Retail service using wholesale or partner-delivered access | Underlying access provider, interconnection, fault ownership, cost and route dependencies |
For procurement teams, the distinction becomes concrete in a quote. Two providers can show the same city on a map, but one may offer a low-cost on-net Ethernet handoff while the other must build a three-mile extension. A third may use an existing wholesale local loop. Their service proposals could differ substantially in construction risk, installation interval, recurring cost, and ownership of the physical access segment.
A useful quote should identify product-specific serviceability, local construction or survey contingencies, bandwidth and interface constraints, and the party responsible for access restoration. If two proposed circuits depend on one local-loop supplier or entrance facility, the buyer should investigate shared-risk exposure as discussed in Carrier Diversity vs. Path Diversity.
Global Network Coverage: Footprint Is Not the Same as Service Reach
Global carriers often describe their networks in terms of route miles, countries served, POPs, Internet exchanges, and interconnected data centers. These figures can be useful, but they represent different dimensions of capability. An ISP with hundreds of backbone POPs may have limited direct access at some enterprise locations, while another provider with fewer owned facilities may deliver a well-managed service through extensive access partnerships.
Four dimensions should be separated. Infrastructure footprint is where the carrier has relevant assets or directly operated facilities. Commercial reach is where it can arrange services through its own facilities and suppliers. Product-specific reach is where a particular service—such as 10 Gbps DIA, private Ethernet, or an optical wavelength—can actually be supplied. Application reach concerns whether the network provides appropriate connectivity to the enterprise’s users, cloud platforms, suppliers, and customers.
GTT’s global network page explicitly distinguishes a map of its owned-and-operated POPs from broader service delivery supported by thousands of cloud and connectivity partners. That is precisely the distinction enterprise buyers need to make. Country-level coverage claims describe geographic commercial reach, not direct owned fiber to every requested building.
For an enterprise with offices in Boston, Paris, Mumbai, and Singapore, compare the proposed service and delivery chain in each market. One provider might have the broadest IP backbone; another might offer a stronger local access solution for the enterprise’s most important facility.
Global reach also involves operational complexity. Some countries have local licensing, cross-border, data-residency, or supplier constraints. Availability and commercial terms can change by jurisdiction. The map is a way to identify promising carriers; only country- and site-specific engineering and commercial validation can establish the proposed delivery approach.
How to Read Submarine Cable Routes on an ISP Map
Submarine cables are a critical component of international connectivity. On a global ISP map, an arc across the Atlantic or Pacific may suggest that the carrier can support traffic between continents. It usually does not tell the buyer the precise path of the subsea system, the carrier’s ownership share, its terrestrial backhaul design, or how its IP network will select a path at any given time.
TeleGeography explains that the submarine cable routes shown on its public map are stylized and do not represent the precise geolocation of every system. That makes the map an excellent research tool for cable systems and landing points, but not a substitute for detailed marine or terrestrial route documentation. The same caution applies to lines across oceans on a carrier’s marketing map.
A Boston-to-Europe connection also depends on domestic transport to a coastal gateway, the selected subsea system, a landing facility, and European terrestrial backhaul before reaching the destination network. Two providers may appear to use different international routes but share an access corridor near the enterprise, a landing-station dependency, or an upstream transport facility.
If international resilience is important, ask which cable systems and terrestrial backhaul arrangements are relevant to the proposed product, what alternate paths are available, and whether any diversity promise is contractually defined. A carrier’s participation in multiple submarine systems provides potentially valuable options. It does not prove that a specific customer circuit or IP flow is pinned to two completely independent end-to-end paths.
Another source of confusion is the word direct. A network diagram showing a transatlantic line does not necessarily indicate direct IP peering between the two endpoint networks, nor that packets avoid intermediate routers. It could depict available transport infrastructure rather than the actual layer-3 forwarding decision. Geography is only one input to Internet routing.
POPs, Peering, and Internet Exchange Points
Some of the most important POPs are located in major interconnection markets such as Northern Virginia, Frankfurt, London, Amsterdam, Singapore, and other data-center hubs. These locations concentrate network operators, cloud connectivity options, exchanges, and private interconnection facilities. A carrier presence in such a location can be strategically valuable because it provides options for reaching other networks or cloud services.
However, a network appearing in the same facility as another network does not prove the two are directly connected. Two carriers might exchange traffic at an Internet exchange, purchase transit from one another, establish a private network interconnect, or remain present in the same building without any direct relationship. Physical proximity is an opportunity for connectivity, not confirmation of an active peering session.
PeeringDB is a useful complementary source because it is a community-maintained database of networks, Internet exchanges, and interconnection facilities. It can help a technical team identify where operators report presence and how they may interconnect. But the data is maintained by participating organizations and does not certify every live circuit, BGP session, physical route, or customer-specific service configuration.
A carrier map and PeeringDB together can generate better questions. If a provider shows a POP in a relevant metropolitan data center, determine whether the precise facility supports the desired port, whether a cross-connect is available, and which specific service or network is offered. If access to a certain cloud or partner network is important, verify the actual interconnection option rather than assuming that nearby dots on a map mean traffic takes a direct route.
For additional background on these relationships, see Macronet Services’ guide to Internet Exchange Points and Internet Peering. The important map-reading lesson is that presence, connection, and routing policy are three separate facts.
Can a Network Map Predict Latency or Performance?
Geography can influence network performance, but an ISP network map is not a latency guarantee. The apparent distance between two POPs is only one contributor to end-to-end delay. Actual performance also depends on fiber length, optical equipment, intermediate transport and routing hops, interconnection, BGP policy, congestion, access-network design, and the applications being measured.
The fastest geographic corridor between two cities is not necessarily the route an IP packet will take. BGP prioritizes policy and reachability rather than calculating the shortest physical distance on a map. A carrier can send traffic toward a preferred peering or transit point for operational or commercial reasons. The return path may differ from the forward path, complicating attempts to infer end-to-end performance from a single diagnostic trace.
An IP traceroute is useful but not a physical-route survey. Router responses can reflect load balancing, tunneling, filtering, and different paths for probe packets. The locations associated with router names or IP geolocation records may also be misleading. A traceroute that appears to connect city A to city B does not prove the underlying fiber follows the visible geographic line. Conversely, a missing hop does not mean there was no intermediate equipment.
Two strong supporting resources are RIPE Atlas, which provides distributed Internet measurement vantage points, and NTT’s Global IP Network Looking Glass, which provides routing information. NTT explicitly cautions that its looking glass is not an appropriate instrument for measuring service-level agreements. That distinction should shape every performance assessment: diagnostic visibility and contracted measurement methodology are not interchangeable.
A more credible approach starts by specifying the actual endpoints and applications. A business might measure round-trip time, packet loss, and jitter from its office to the cloud front ends and data centers it uses, then compare results across time periods and carriers. It should request representative carrier POP-to-POP measurements where available, while recognizing that customer access adds delay and may be the dominant performance variable. Macronet Services discusses these distinctions in its Tier 1 ISP Global Latency Samples resource.
The map should help choose where to measure; measurements should determine how the service actually performs. Neither a world map nor a handful of latency screenshots can establish every operational requirement, but they can combine to produce a more defensible provider comparison.
Can You Verify Network Redundancy from a Backbone Map?
Backbone maps often show multiple lines between major markets, intercity rings, alternate data centers, or geographically separated POPs. These may indicate that a carrier has useful restoration and diversity options. They do not, on their own, demonstrate that two proposed enterprise circuits are physically independent.
Different retail ISPs may share the same local fiber cable, duct bank, building entrance, regional aggregation facility, or transport supplier. Even two routes that diverge on a public map may share hidden intermediate infrastructure. The relevant engineering question is therefore which failures the business needs to survive: a local cable cut, a serving-facility failure, a regional transport incident, an ISP routing problem, or a larger outage affecting the customer location.
For critical designs, ask the carrier for the diversity scope: separate entrances, local loops, metro paths, backbone facilities, access suppliers, and relevant single points of failure. Exact maps may not be releasable for commercial or security reasons, but a written, bounded engineering attestation can still be useful. Unverified diversity is not the same as proven diversity, and adding a second provider name does not remove that uncertainty.
Macronet Services examines the full engineering approach in Carrier Diversity vs. Path Diversity and Dual ISP Redundancy. Here, the map’s role is to identify plausible alternate routes that merit investigation.
How Cloud Connectivity and AI Infrastructure Change Map Analysis
Enterprise network maps increasingly highlight data-center clusters, cloud connectivity points, wavelength routes, and high-capacity infrastructure serving compute-intensive applications. For organizations moving large datasets, operating distributed cloud services, or supporting AI workloads, those details can matter as much as conventional Internet backbone coverage.
A cloud on-ramp is a location or service arrangement through which an enterprise can connect to a cloud provider’s private connectivity ecosystem. It should not be confused with a cloud region where compute resources actually run. A provider map may show a cloud-connectivity hub in the same city as an enterprise location, but an actual deployment still requires qualification of the access circuit, cloud connection product, available bandwidth, network exchange or interconnection arrangement, and regional reach.
Microsoft’s ExpressRoute connectivity-location documentation makes the distinction concrete: peering locations, connectivity providers, and cloud regions are related but separately defined. An enterprise selecting a cloud-connected carrier should confirm which peering locations and service regions it can reach, whether the connectivity is dedicated or shared, and what failure domains the design introduces.
For AI infrastructure, network requirements are especially application-specific. A large, scheduled data replication workload may place more emphasis on bandwidth and transfer economics. A latency-sensitive inference service may need predictable paths to a regional compute endpoint. Distributed training or storage architectures may require carefully designed high-capacity private transport rather than conventional best-effort Internet access.
Map analysis is therefore becoming part of infrastructure-readiness planning. The network’s most important routes may connect an enterprise’s facilities, colocation sites, and cloud environments rather than the largest number of geographic markets. The related service architectures are covered in Macronet Services’ Data Center Connectivity guide and Multi-Cloud Networking guide.
Real-World Examples: What Leading Carrier Maps Actually Tell You
Official carrier material provides useful examples of how symbols and disclosures differ. The interpretations below reflect the sources checked in November 2026; dated mapbooks are historical illustrations, and current service capability must be assessed through updated carrier information.
Arelion: A legend that distinguishes POPs and fiber arrangements
Arelion’s North America PDF map identified as as built: January 2025 illustrates a useful convention: it distinguishes individual POPs from markets containing multiple POPs, and Arelion-owned fiber from leased network segments. The published map also says it is not to scale. The distinctions are unusually helpful because they prevent readers from assuming that every route line represents the same asset arrangement.
Consider a city marked with multiple POPs. The symbol suggests more than one reported presence point, but does not show whether those locations share an entrance facility or whether the proposed service is offered at both. Likewise, an owned-fiber marking provides information about an asset relationship, not an end-to-end diversity guarantee. For live evaluation, start with Arelion’s current network interface, filter by the relevant service, and ask for facility-level and route-level confirmation. The 2025 map is a dated explanatory reference, not a November 2026 service inventory.
Zayo: Core infrastructure and customer access are different networks
Zayo’s network page presents distinct views of its infrastructure and capabilities, including long-haul and metro fiber, wavelengths, IP network coverage, and on-net facilities. Its July 2024 mapbook distinguishes Core POPs and Access POPs, core and access network routes, and cable landing stations. This is a practical example of why the phrase “Zayo has a network in the city” is not enough to characterize the offering.
For an enterprise requesting dark fiber between facilities, the appropriate network view might differ from the one used to evaluate IP transit or a dedicated Internet service. A route shown as optically enabled does not establish that every access POP offers identical IP services. A metro fiber footprint does not automatically make a nearby building on-net for a specified capacity. The procurement team should select the appropriate product-specific map and confirm the exact address, interface, and implementation requirements.
For example, a 400G-enabled backbone facility may be relevant to an IP transit request, while an adjacent metro access route may matter more to a private Ethernet or dark-fiber deployment. Product-specific map layers must be compared with the actual orderable handoffs.
Lumen and GTT: Direct network presence versus extended service delivery
Lumen’s map disclaimer acknowledges that the displayed global network includes segments under different ownership or use arrangements, with regional carrier support in some markets. GTT’s global network description separately describes its owned-and-operated POPs and broader services made possible through its connectivity partner ecosystem. These are not identical network models, but both show why “global coverage” must be translated into a specific delivery chain.
A buyer comparing service to a site in a secondary international market may find that both carriers can supply the required bandwidth, yet use different local access operators, handoff facilities, commercial terms, or operational arrangements. A map alone will not rank those designs accurately. The better process is to compare confirmed serviceability, local-loop arrangement, backbone entry point, application performance, and support responsibilities at each location.
The GTT/Lumen comparison illustrates two separate due-diligence questions: where does the provider directly operate equipment, and how is a customer service delivered beyond that footprint? They are related, but the answers may come from different operational teams.

How to Verify an ISP Network Map Before Buying Service
Good diligence combines published topology, external observations, and provider-confirmed engineering. Each contributes a different type of evidence. None replaces the others.
Start with the network provider’s current, product-specific materials, including its network map and technical description. Record the map date, supported technologies, relevant POPs, and any qualifications about owned, leased, or partner facilities. Mark what is explicitly stated and avoid turning unqualified visual assumptions into facts.
Use public data to investigate the surrounding network. PeeringDB can suggest reported network presence and interconnection opportunities; RIPEstat can help analyze BGP and IP resource information; RIPE Atlas supports active Internet measurements; and TeleGeography’s Submarine Cable Map can clarify international cable systems and landing locations. These tools are complementary. They do not prove a commercial access circuit exists at an office or that an advertised fiber route is physically diverse.
Then request evidence tied to the proposed service. A practical carrier response should include the precise on-net, near-net, or off-net status of each location; the local access design; available speeds and interfaces; the likely installation path; the facility or NNI where the service reaches the relevant backbone; and any known exceptions to required route diversity. Performance commitments must be defined at relevant demarcation points and under an agreed measurement methodology.
A public availability database is not a substitute for this step. For instance, the FCC National Broadband Map is useful for researching reported U.S. mass-market broadband availability, but it does not provide comprehensive address-level qualification for custom enterprise DIA and private fiber builds.
For each material claim, record its evidence status. The distinction below prevents a carrier’s global brochure, third-party routing record, and a confirmed engineered design from being treated as equivalent.
| Evidence status | Example | How to use it in sourcing |
| Confirmed | Carrier’s address-specific engineering qualification or documented design | Eligible for scoring against the stated requirement |
| Observed | Public POP listing, RIPE Atlas measurement, or disclosed route marker | Useful corroboration, but not necessarily confirmation of the proposed service |
| Unverified | An inferred fiber path, assumed on-net building or undocumented diversity claim | Retain as an open question; do not award full credit |
| Not available | Provider states the product or mandatory design cannot be supplied | Fail that requirement, regardless of global footprint |
Require a named owner and deadline for any unresolved high-impact assumption. Where the provider cannot release a route-level drawing, request a written description of the independence being promised, including the failure domains it does and does not cover.
Comparing Carrier Maps: The Enterprise Network Footprint Scorecard
Because the best network depends on the enterprise’s real locations and applications, a simple city or POP count is rarely an adequate selection method. A more useful comparison evaluates how well the carrier’s network and delivery arrangements match the business requirements. The scorecard below is an illustrative Macronet Services framework; it should be customized to the business’s risk tolerance, traffic patterns, and sourcing objectives.
| Network evaluation dimension | Illustrative weight | What evidence matters |
| Site-level serviceability | 25% | Address qualification, required speed, port and handoff availability |
| Backbone reach to critical regions | 15% | Relevant POPs, regional corridors, intercity connectivity |
| Access architecture and dependencies | 15% | Local-loop suppliers, construction, NNI and serving facilities |
| Performance to key destinations | 15% | Measurements, SLAs, application-path evidence |
| Resilience and physical diversity | 15% | Documented route and facility separation for relevant risks |
| Cloud/data-center interconnection | 10% | Qualified on-ramps, cross-connects and region reach |
| Transparency and engineering evidence | 5% | Accurate diagrams, disclosures, change-management information |
| Total | 100% | Network suitability, not total commercial value |
Consider a hypothetical organization with sites in three North American cities, a European data center, and mission-critical applications in two cloud regions. Carrier A has the largest visible worldwide backbone, but two facilities require expensive off-net access and the proposed secondary route remains unverified. Carrier B has a smaller global footprint but is on-net at the largest offices, offers documented access diversity, and has competitive connectivity to the relevant cloud platforms. Carrier C reaches every country through partners but has less attractive lead times in the company’s most important market.
A scorecard based only on POP counts might favor Carrier A. A requirements-based assessment could favor Carrier B for the main contract, using Carrier A or C selectively where their access and backbone arrangements are stronger.
Apply mandatory gates before calculating a weighted score. If a provider cannot supply the required 10 Gbps handoff at a critical facility, cannot meet a non-negotiable installation date, or cannot substantiate a contractually required physically diverse access path, mark that bid noncompliant or conditional for the relevant site. A 95-point score elsewhere does not cure that failure. An unresolved mandatory requirement must remain open; it should never quietly become a passing assumption.
For providers that pass the gates, score each dimension from 0 (does not meet requirements) to 5 (strongly meets requirements) and multiply by the stated weight. For example, a serviceability score of 4/5 contributes 20 of the possible 25 points. Use published evidence statuses: a claimed capability supported only by a marketing map should not receive the same score as an engineered, address-qualified solution. If evidence is missing, record a provisional range or hold the score pending confirmation rather than assigning a fictitious precise value.
The table evaluates network suitability, not the total commercial decision. Recurring and nonrecurring charges, implementation schedule, contractual terms, service credits, billing, support performance, and global-versus-regional sourcing strategy belong in the final procurement model.
How Macronet Services Helps Enterprises Evaluate Global ISP Networks
Macronet Services helps enterprise organizations evaluate global carrier options, compare network architectures, and source connectivity aligned with business requirements. This work goes beyond reviewing network maps: it connects the carrier’s backbone and access capabilities with the actual sites, data centers, cloud environments, performance expectations, and resilience objectives involved in a deployment.
When an enterprise is comparing providers, the relevant questions are often practical. Which carrier can truly deliver at the requested address? Which proposed circuits rely on wholesale access? Where will traffic enter the backbone? What is the likely cost and timing of the build? How much diversity is supported by engineering evidence rather than marketing language? A structured assessment can expose these differences before contracts are signed.
For organizations planning global WAN transformation, DIA sourcing, data-center connectivity, or AI-ready network infrastructure, contact Macronet Services to discuss the available carriers and the architecture best suited to your requirements.
Frequently Asked Questions About ISP Network Maps
What is an ISP network map?
An ISP network map represents elements of a provider’s network or service reach, often including backbone routes, POPs, interconnection hubs, fiber corridors, and coverage markets. Its exact meaning depends on the map type and legend. A public map generally does not prove service availability, physical route details, or performance at a specific customer address.
How do you read an ISP backbone map?
First identify the network layer and product, then read the legend and publication date. Locate the relevant POPs and backbone links, distinguish owned or directly operated routes from other arrangements where disclosed, and confirm the carrier’s actual serviceability and design for the enterprise locations involved.
What does POP stand for in telecommunications?
POP stands for Point of Presence, a location where a carrier maintains network equipment or interfaces. POPs can serve backbone, access, aggregation, transport, or interconnection purposes. A carrier’s POP in a city does not mean every nearby building is on-net.
What is the difference between a core POP and an access POP?
A core POP generally supports major backbone functions and high-capacity intercity or regional connections. An access POP tends to serve customer access or metropolitan aggregation. Providers may use these terms differently, so product capabilities must be verified at the exact facility.
Does an ISP POP near my building mean the carrier can serve it?
Not necessarily. A nearby POP can create an attractive connection option, but the final local loop may require construction, a building lateral, a separate provider, or another transport arrangement. Obtain address-specific qualification for the requested product and speed.
What is the difference between on-net, near-net, and off-net?
On-net generally indicates existing carrier connectivity at or serving a building; near-net suggests nearby infrastructure that may need an extension; and off-net often indicates access through another provider. The precise definitions and service implications vary by carrier.
Do lines on a carrier map show actual fiber routes?
Sometimes, but not always. An IP backbone line may represent a logical relationship rather than precise fiber geography. Even physical or submarine route maps can be schematic or stylized. Check the legend and ask for engineering documentation if exact route location matters.
Can an ISP network map tell me which carrier has the lowest latency?
No. Maps show potential connectivity and geographic relationships, not measured end-to-end performance. Compare service-specific metrics from appropriate endpoints, consider access latency and peering, and evaluate performance against the enterprise applications that matter.
Does having more POPs make an Internet provider better?
Not automatically. POP counts can reflect network breadth, but the relevant question is whether a provider has the right presence, service availability, interconnection, capacity, and support model for your specific sites and destinations.
Can I verify redundant fiber routes using a public network map?
A public map may suggest alternative corridors or facilities, but it rarely proves end-to-end route independence. Important connections may share cables, conduits, buildings, or transport suppliers. Obtain a scoped diversity assessment or engineering confirmation where resilience is critical.
Where can I find maps for global Internet providers?
Begin with official carrier network pages such as those published by Arelion, Zayo, Lumen, GTT, and Hurricane Electric. Use PeeringDB for reported interconnection presence, RIPE Atlas for Internet measurements, and TeleGeography for submarine systems. Each answers a different question and should be interpreted accordingly. Contact us at Macronet Services for more detail on any ISP and to have us help you with a free network design and unbiased circuit sourcing.
Conclusion: A Carrier’s Map Is the Beginning of Due Diligence
An ISP network map can reveal a great deal about the potential reach of a carrier. It can show important backbone hubs, opportunities for interconnection, metro access concentration, and geographic routes that deserve closer examination. The best maps also disclose meaningful distinctions between POP types, network layers, and infrastructure arrangements.
What a map cannot reliably provide is equally important. It usually does not certify building-level serviceability, identify every local access provider, establish physical route independence, or predict performance for the applications your organization actually uses. Those questions require current engineering information, practical measurements, and a qualified service proposal.
For enterprise decision-makers, the most useful habit is to distinguish visible infrastructure, commercial reach, and verified delivery capability. The best carrier is not necessarily the one with the most lines on the map. It is the one whose proven network architecture, access arrangements, performance, and commercial terms most closely match the business’s needs.