

Data Center Colocation Pricing: The Complete Enterprise Cost Guide for 2027
Data center colocation pricing has never been as simple as comparing the monthly cost of one cabinet with another. In 2027, that is even more true.
Enterprise buyers are entering a market shaped by historically low vacancy, limited power availability, AI-driven demand, longer infrastructure lead times and increasingly complex commercial structures. CBRE’s North America Data Center Trends H1 2026 reported that primary-market supply increased 33.7% year over year to approximately 10.9 GW, yet vacancy still declined to only 1.4%. More than 80% of capacity under construction had already been committed.
That combination—record construction and extraordinarily little available capacity—helps explain why colocation pricing continues to rise. The market is also changing in a more fundamental way: data center economics are becoming increasingly centered on deliverable power rather than physical floor space.
A facility may have available square footage but still be unable to support another 500 kW, 2 MW or 10 MW deployment on the customer’s required timeline. This distinction becomes particularly important as enterprises adopt AI infrastructure, because higher-density workloads place very different demands on electrical distribution and cooling.
The correct question is therefore no longer simply, “What does colocation cost?” The better question is:
What is the true cost of the colocation architecture our business requires, in the market where we need it, at the density and resiliency we require, under the contract structure being proposed?
This guide is designed to answer that question.

How Data Center Colocation Pricing Actually Works
Colocation pricing generally reflects three underlying resources: space, power and infrastructure services. How those resources are priced changes considerably as a deployment grows.
A company leasing one or two cabinets may receive a straightforward monthly cabinet price. An enterprise requiring 100 kW may instead lease a private cage with an aggregate power commitment. At 500 kW or several megawatts, the commercial conversation increasingly revolves around dollars per kilowatt per month, delivery dates, utilization commitments and long-term power availability. These are all forms of colocation, but they should not be compared using the same pricing metric.
Cabinet-Based Pricing
Smaller retail deployments are commonly priced by cabinet. A provider might quote a full cabinet together with a defined power allocation and basic facility access. The problem is that cabinet prices are meaningless without context. A cabinet with 2 kW of usable power is not directly comparable with one providing 5 or 10 kW. One quote may include redundant A+B power feeds while another does not. Internet access, remote hands and cross connects may be included, discounted or completely separate.
The useful comparison is therefore not simply price per cabinet. It is price per cabinet at the required power density, redundancy level and service profile.
Cage and Enterprise Pricing
As deployments become larger, enterprises often move into private cages containing multiple cabinets. The commercial model then begins shifting away from the rack and toward the amount of power reserved for the environment.
This raises a different set of questions. How much capacity is contractually committed? Can the enterprise expand later? Does unused power remain reserved? Is electricity included in the base price or passed through separately? For a 100-kW environment, those questions can matter much more than the cost of an individual cabinet.
Pricing Per Kilowatt
For larger enterprise and wholesale deployments, one of the most useful benchmarks is dollars per kilowatt per month. If an enterprise leases 500 kW at $200 per kW per month, the base monthly charge is approximately $100,000, or $1.2 million per year, before adding many ancillary services.
The apparent simplicity of $/kW pricing can still be deceptive. A buyer must determine whether the rate includes electricity, whether actual consumption is passed through separately, what resiliency level is being provided and whether taxes or common-area expenses are additional. A lower $/kW quote may simply exclude more.
Metered, Committed and Take-or-Pay Power
Under a metered model, the tenant’s cost varies with actual consumption. This can be attractive when utilization fluctuates, but the buyer needs to understand utility rates, PUE methodology, demand charges and any provider markup. Under a committed-power model, the enterprise pays for reserved capacity regardless of actual load.
In today’s constrained market, minimum-utilization provisions are becoming more important. CBRE reports that some U.S. agreements now use take-or-pay floors requiring tenants to pay for roughly 60% to 85% of allocated power even if actual utilization is lower. For a company reserving 1 MW, an 80% floor can mean paying for at least 800 kW while the equipment footprint is still ramping.
Accurate capacity forecasting is therefore a financial issue, not simply an engineering exercise.
Retail vs. Wholesale Colocation
One of the most important distinctions in colocation pricing is the difference between retail and wholesale colocation. Retail colocation generally serves smaller environments and bundles more services into the offering. The customer may lease one cabinet, several cabinets or a modest private cage. The effective cost per kilowatt is typically higher, but the enterprise receives greater flexibility and avoids committing to a large block of capacity.
Wholesale colocation is designed for larger requirements. Instead of purchasing individual racks, the tenant may commit to hundreds of kilowatts or multiple megawatts. At that scale, pricing is commonly expressed in $/kW/month and the customer may take greater responsibility for racks, internal cabling, networking and operational design.
There is no universal threshold between the two models. A practical way to think about the continuum is small retail → enterprise cage → large enterprise → wholesale → hyperscale. As the deployment moves across that spectrum, the critical commercial question changes. At small scale, the buyer asks what a cabinet costs. At larger scale, the buyer asks what committed power costs. At multi-megawatt scale, the most important question may become: when can the power actually be delivered?
For readers evaluating provider types and the broader colocation model, Macronet Services’ Top 5 Colocation Data Center Providers in 2026 provides additional context on colocation services, facility infrastructure and provider selection.
The True Cost of Colocation
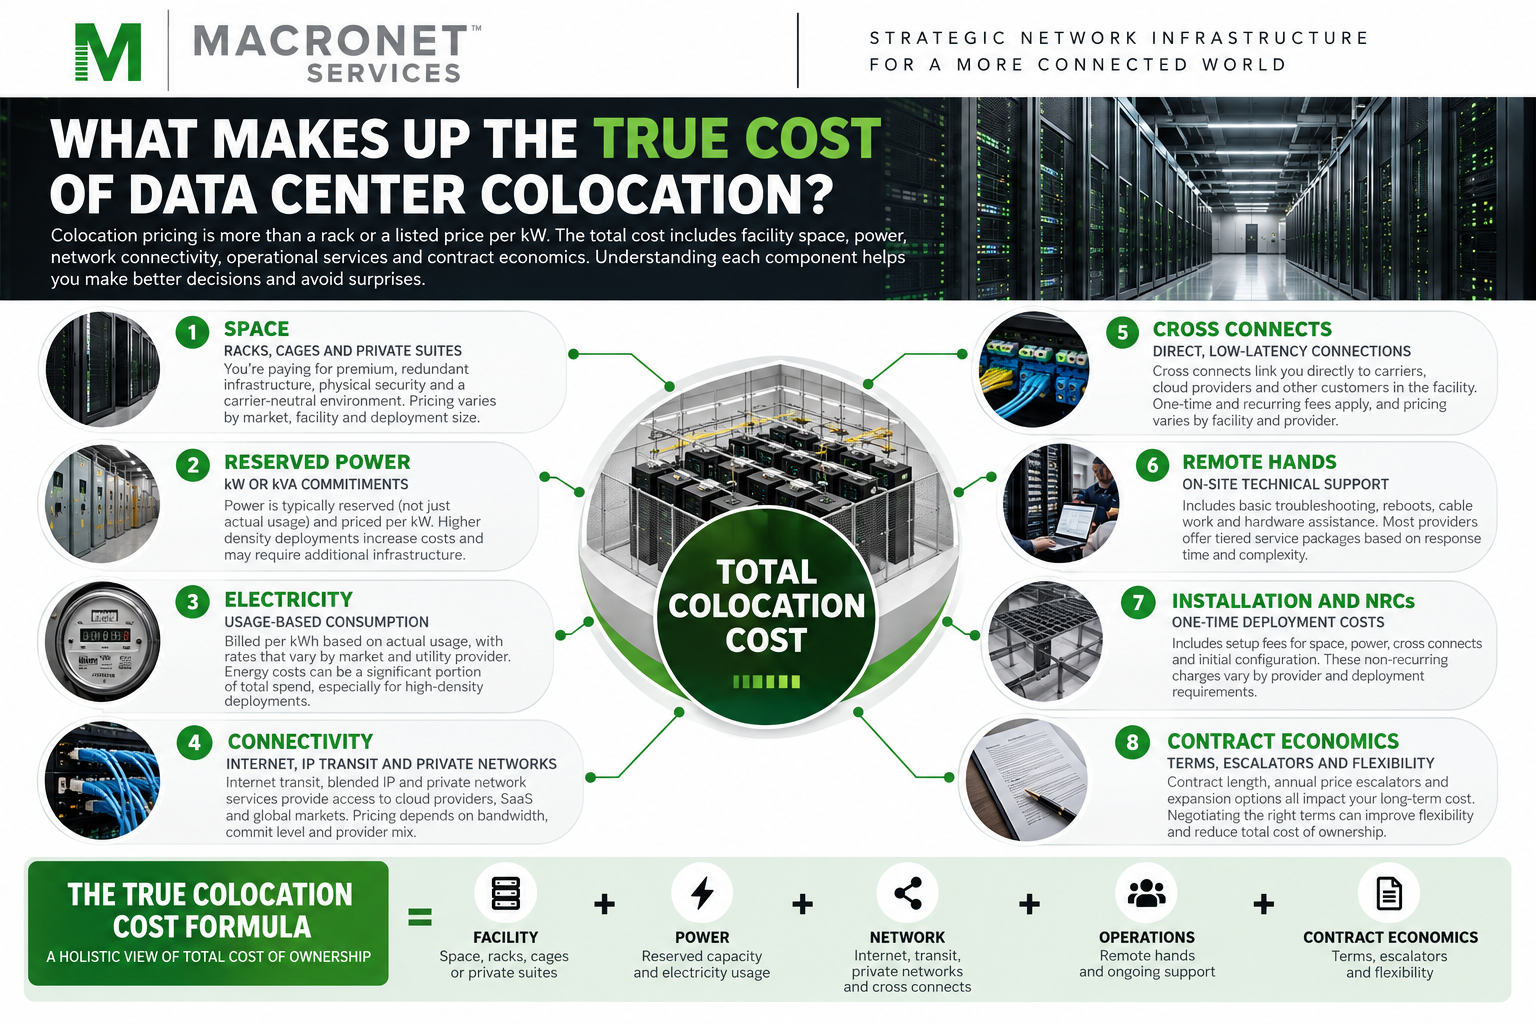
The headline rate is only one part of the colocation bill. A more useful representation of total cost is:
True Colocation Cost = Space + Reserved Power + Electricity + Connectivity + Cross Connects + Operations + Installation + Taxes + Contract Escalation
Depending on the deployment, cloud connectivity, DCI, liquid cooling, network-as-a-service platforms or specialized construction may also be material.
Power and Electricity
For most larger deployments, power is the dominant facility cost. But the buyer needs to understand whether electricity is included in the quoted capacity rate or charged separately. A utility passthrough model can make two apparently similar quotes behave very differently as utilization increases.
Power economics also vary significantly by geography. The U.S. Energy Information Administration’s Electric Power Monthly provides current state-level commercial and industrial electricity-price data. That information should not be treated as a direct proxy for colocation pricing, but it helps explain why otherwise similar data center markets can have very different operating economics.
Connectivity and Cross Connects
Carrier-neutral data centers create value by giving enterprises access to multiple carriers, Internet providers and cloud platforms. That connectivity is rarely free. Cross connects commonly have both installation and recurring monthly charges, while Internet connectivity, private cloud access, Ethernet, wavelength services and DCI typically sit outside the basic colocation price.
Macronet Services’ Data Center Cross Connects: Enterprise Guide explains the physical and commercial role of cross connects, Meet-Me Rooms, MRC/NRC economics and the risk of unused “zombie” interconnections.
Connectivity also needs to be evaluated as part of the facility-selection decision. Macronet Services’ Data Center Connectivity: Carriers, Cloud On-Ramps, Cross Connects & Internet Access explains why a slightly higher occupancy cost can still produce a lower total solution cost when the required carriers, cloud on-ramps and interconnection options are available locally.
For Internet-heavy environments, carrier quality also matters. Macronet Services’ Tier-1 ISPs and Global Enterprise Networks: Performance, Resilience, and Risk Explained examines why identical-looking bandwidth offers can sit on very different backbone architectures.
Cloud Connectivity
Private access to AWS, Microsoft Azure, Google Cloud or Oracle Cloud can introduce several separate charges. The enterprise may pay for a physical cross connect, carrier transport or interconnection fabric, plus cloud-provider connectivity and data-transfer charges.
Macronet Services’ Multi-Cloud Networking: The Complete Enterprise Guide examines how colocation facilities, carriers, cloud on-ramps and network-as-a-service platforms fit together in distributed enterprise environments.
Operations, Remote Hands and Escalators
Remote hands may look like a minor line item until the facility is several hours or several states away from the enterprise IT team. A higher-cost facility that provides excellent on-site operational support can sometimes reduce travel, staffing and outage-related costs enough to justify the difference.
Long-term agreements also frequently contain annual increases. A $100,000 monthly commitment with a 4% annual escalation reaches roughly $117,000 per month by year five. Enterprise buyers should compare total contract value, not simply year-one pricing.
Data Center Pricing by Deployment Size
Colocation pricing does not scale linearly because the product itself changes as deployments become larger.
Small Retail Deployments
For one to five cabinets, flexibility usually matters more than obtaining the lowest possible $/kW rate. Typical use cases include network hubs, disaster recovery, edge infrastructure and smaller private-cloud environments. These deployments are often best compared on an all-in monthly basis because the facility, power and operating-service bundle can vary considerably.
Mid-Market Enterprise Deployments
Between roughly 25 and 250 kW, buyers increasingly need to evaluate aggregate power economics rather than cabinet prices. This segment is particularly important for traditional enterprise IT because a single facility may support databases, storage, private cloud, security infrastructure, WAN aggregation and cloud interconnection simultaneously. Carrier availability and future power expansion can become almost as important as the initial rate.
250 to 500 kW
At this size, institutional wholesale benchmarks become more relevant. CBRE’s 2026 U.S. data center outlook indicates that average primary-market asking rents for 250-to-500-kW N+1/Tier III-equivalent requirements were expected to remain above roughly $215/kW/month in 2026. This is a useful wholesale benchmark, but it should not be interpreted as the retail price of every enterprise colocation deployment.
500 kW to 3 MW
Competition for this category has intensified. CBRE reported asking-rate increases of 7.9% in H1 2026 for requirements between 500 kW and 3 MW. At this point, delivery timing becomes a major component of value. An inexpensive 2 MW proposal that cannot be energized until 2029 may be less useful than a higher-priced alternative capable of supporting production much sooner.
3 MW and Above
For requirements between 3 MW and 10 MW, CBRE reported an 8.3% pricing increase in H1 2026—the largest increase among its four requirement-size categories. At 10 MW and above, tenants may influence cooling architecture, utility planning, construction sequencing and facility design. The conversation is no longer simply about leasing data center space; it is about reserving infrastructure.
Major U.S. Data Center Markets
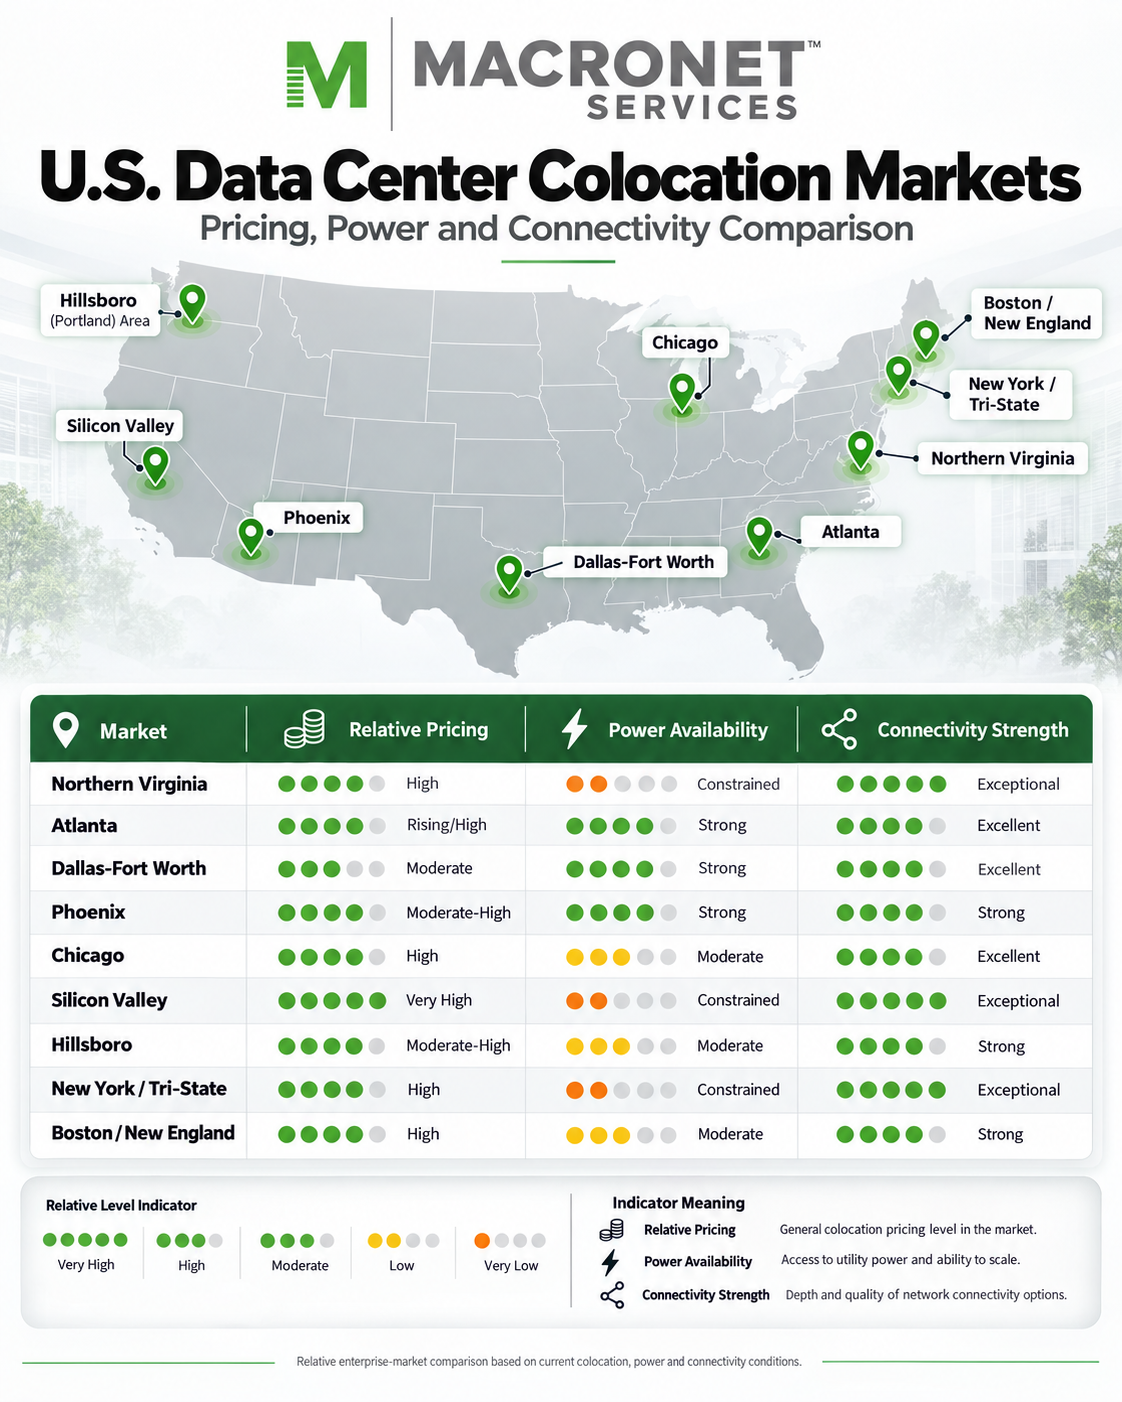
The United States does not have one national colocation market. It has regional markets whose economics reflect local power, land, fiber, cloud presence, taxes, construction conditions and supply. CBRE identifies eight primary North American data center markets: Northern Virginia, Atlanta, Dallas-Fort Worth, Phoenix, Chicago, Silicon Valley, Hillsboro and New York/Tri-State.
Together, those markets contained approximately 10.9 GW of inventory in H1 2026, yet only 1.4% of capacity was vacant. This tight supply makes market selection increasingly strategic.
Northern Virginia
Northern Virginia remains the dominant U.S. data center market. CBRE reported approximately 4,496.5 MW of inventory in H1 2026 and vacancy of just 0.2%. For 250-to-500-kW requirements, CBRE reported Q1 2026 asking rents of approximately $190 to $235/kW/month. At 500 kW, that equates to an illustrative base occupancy range of roughly $95,000 to $117,500 per month before connectivity and other services.
Northern Virginia’s pricing is supported by an extraordinary cloud and carrier ecosystem, but its largest constraint is increasingly power. For substantial requirements, the question is often less about finding a data center and more about finding one with power available on the required date.
For deeper regional detail, see Macronet Services’ Data Center Colocation in Virginia: Pricing, Connectivity, Power & Provider Guide.
Atlanta
Atlanta is undergoing one of the fastest expansions of any U.S. market. In H1 2026, CBRE reported approximately 1,803 MW of existing inventory and nearly 2,882 MW under construction, allowing Atlanta to overtake Northern Virginia as the largest construction market in North America. Its advantages include fiber connectivity, favorable development economics and access to large-scale power projects.
Those advantages are attracting enough demand that Atlanta should no longer be viewed simply as a lower-cost alternative. CBRE reported pricing increases across every major deployment size in H1 2026. Atlanta is becoming a primary market in its own right.
Dallas-Fort Worth
Dallas-Fort Worth combines major-market network depth with relatively favorable development economics. CBRE reported approximately 1,433 MW of inventory in H1 2026. Dallas benefits from central geography, extensive fiber and Texas’s deregulated electricity environment. Unlike some other large markets, Q1 2026 wholesale asking rates were relatively stable year over year.
That does not mean power is unlimited. Grid-interconnection timelines remain an important consideration. For enterprise buyers, Dallas continues to offer one of the strongest combinations of scale, connectivity and economics.
See Macronet Services’ Data Center Colocation in Dallas: Pricing, Connectivity, Power & Provider Guide for deeper local-market detail.
Chicago
Chicago remains one of the country’s most important enterprise data center markets. Its central geography, dense telecommunications environment and strong financial-services ecosystem make it particularly valuable for enterprises.
That value is reflected in price. CBRE’s Global Data Center Trends 2026 reported Q1 2026 wholesale asking rents of approximately $200 to $230/kW/month for 250-to-500-kW requirements—among the highest of the major U.S. markets.
Macronet Services’ Data Center Colocation in Chicago: Pricing, Connectivity, Power & Provider Guide provides a more detailed look at Chicago’s facility and connectivity ecosystem.
Phoenix
Phoenix has grown into a major western U.S. data center market, with CBRE reporting approximately 1,069 MW of inventory in H1 2026. Its rise has been driven partly by companies seeking western infrastructure outside California. Phoenix offers significant scale and favorable geographic characteristics for many applications, but rapid development means it should no longer be treated automatically as a low-cost market. Power availability and delivery timing should be evaluated facility by facility.
Silicon Valley
Silicon Valley remains one of the most expensive and supply-constrained U.S. data center markets. CBRE reported asking rents of roughly $200 to $275/kW/month in H1 2026, with inventory of about 509 MW. The market’s premium reflects its position at the center of the technology and AI ecosystem, but power and land constraints remain significant.
Macronet Services’ Data Center Colocation in Silicon Valley: Pricing, Connectivity, Power & Provider Guide provides additional regional detail.
Hillsboro, Oregon
Hillsboro has evolved into an important West Coast data center hub, particularly for cloud and trans-Pacific connectivity. CBRE reported approximately 491 MW of inventory in H1 2026 and only around 1.1 MW of available capacity. That tiny amount of vacancy is more important than any generalized price assumption. Enterprises should begin capacity searches early.
New York / Tri-State
The New York/Tri-State market is much smaller by wholesale inventory than Northern Virginia, Dallas or Atlanta, but its network and financial-services importance is disproportionate to its size. Northern New Jersey in particular supports dense carrier ecosystems and extremely latency-sensitive financial applications.
The market is structurally expensive because of power, real estate and supply constraints. For many enterprise workloads, however, price is not the primary consideration. Proximity to New York, financial exchanges and carrier infrastructure can justify the premium.
| Market | H1 2026 Inventory | Available Capacity | Pricing Environment | Primary Strength |
| Northern Virginia | 4,496.5 MW | 10.8 MW | High | Cloud and network ecosystem |
| Atlanta | 1,803.2 MW | 29.5 MW | Rising | Large development pipeline |
| Dallas-Fort Worth | 1,432.8 MW | 39.6 MW | Competitive for a primary market | Power economics and connectivity |
| Phoenix | 1,069.2 MW | 12.1 MW | Increasing | Western scale |
| Chicago | 910.6 MW | 20.0 MW | High | Enterprise and financial connectivity |
| Silicon Valley | 509.2 MW | 21.2 MW | Very high | Technology and AI ecosystem |
| Hillsboro | 491.4 MW | 1.1 MW | Tight | West Coast / trans-Pacific access |
| New York / Tri-State | 190.0 MW | 13.7 MW | High | Finance and network density |
Inventory and available-capacity figures are from CBRE’s H1 2026 primary-market research. Pricing descriptions are directional and should not be interpreted as quotes for individual facilities.
Important Enterprise Markets Beyond the Eight Primary Markets
Institutional market reports naturally focus on the largest wholesale markets. Enterprise requirements are much more geographically diverse. For secondary markets, public pricing data is thinner, so precise-looking average rates can create false confidence. The more useful approach is to understand power economics, carrier depth, local demand and the strategic role of each market.
Boston and New England
Boston is a premium enterprise market supported by healthcare, biotechnology, finance, higher education and technology. The region’s electricity economics are one reason large compute projects can be challenging: the U.S. EIA reported August 2026 commercial electricity prices in Massachusetts well above many lower-cost U.S. regions. Utility rates do not translate directly into colo rent, but they are an important operating-cost input.
Boston’s attraction is less about hyperscale economics and more about proximity to New England operations combined with strong regional connectivity. It is particularly well suited to enterprise infrastructure, regional network hubs and workloads that benefit from local access. For extremely large AI deployments, power-rich markets elsewhere may provide better economics.
See Macronet Services’ Data Center Colocation in Boston, MA: Pricing, Connectivity, Power & Provider Guide for additional Boston-specific analysis.
Connecticut
Connecticut sits strategically between Boston and the New York metropolitan area. The market can work well for insurance, financial services, healthcare and regional enterprise workloads. Its potential advantage is the ability to remain close to Northeast users and corporate operations without necessarily paying the full premium associated with Northern New Jersey.
The tradeoff is interconnection density. A lower facility cost can be offset if the enterprise must purchase additional transport to reach carriers, cloud on-ramps or network ecosystems in New York or New Jersey.
Macronet Services’ Data Center Colocation in Connecticut: Pricing, Connectivity, Power & Provider Guide explores the market in more detail.
Northern New Jersey
New Jersey remains one of America’s most important enterprise and financial-services colocation markets. The case for New Jersey is connectivity, not low-cost power. Enterprises that require very low latency into New York, access to financial networks or exceptional carrier density may reasonably accept higher facility costs.
Miami and South Florida
Miami occupies a distinctive position as a communications gateway between the United States, Latin America and the Caribbean. For organizations serving Latin American markets, proximity to subsea cable systems and international carriers can make Miami strategically valuable. Hurricane, flood, generator and carrier-route resilience should be evaluated carefully as part of TCO.
Macronet Services’ Data Center Colocation in Florida: Pricing, Connectivity, Power & Provider Guide provides further regional context.
Southern California, Seattle and Emerging Markets
Los Angeles and Southern California offer significant enterprise, media and interconnection infrastructure, but California power, construction and real-estate costs make the region less compelling for workloads that can easily be placed elsewhere. Phoenix can provide an alternative for western compute, while Los Angeles remains strategically valuable for network-rich and media-oriented workloads.
Washington State illustrates another emerging pattern: the best market for connectivity is not always the best market for compute. Seattle provides proximity to enterprise users and cloud ecosystems, while central Washington can offer more favorable economics for large power-intensive deployments. High-capacity DCI can connect the two.
This broader migration toward power-rich markets is visible in JLL’s North America Data Center Report Midyear 2026, which reports that frontier markets account for 77% of North American capacity under construction. West Texas, Ohio, Louisiana, Indiana and the Carolinas have been major beneficiaries.
AI and High-Density Colocation Pricing
Artificial intelligence is changing colocation economics because it is changing power density. The important point is not that every enterprise rack is suddenly 100 kW; it is that the upper end of rack density has moved far beyond what many legacy data halls were designed to support.
The Uptime Institute Global Data Center Survey 2025 found that more than 80% of operators still had no racks above 30 kW, while only a small minority reported very high-density racks. That makes high-density AI capacity specialized rather than universal.
At the design level, ASHRAE’s AI Data Center Energy Performance Framework recommends matching cooling architecture to workload density and specifically discusses liquid or liquid-assisted approaches for AI clusters in the 60–120 kW/rack range and above.
This means an operator may have 1 MW of available capacity in aggregate without being able to deliver ten 100-kW racks in a single data hall. The buyer needs to understand total MW, rack-level density, electrical topology and heat-rejection capability together.
The Uptime Institute Cooling Systems Survey 2025 found that higher rack densities remain the leading driver of direct-liquid-cooling adoption, reinforcing why cooling capability is becoming part of the commercial value of AI-ready colocation.
For enterprises evaluating broader AI readiness, Macronet Services’ Network Infrastructure Assessment Services: A Complete Guide for AI-Ready Enterprises explains why compute, network, cloud and data movement need to be evaluated as one infrastructure system.
What Enterprises Should Negotiate
A colocation agreement can change materially over its life even if the initial price looks attractive. The largest commercial issues usually involve power, escalation, expansion and exit.
A long-term agreement with a low opening rate but an aggressive annual escalator may ultimately cost more than a seemingly higher-priced alternative. Likewise, an attractive 500-kW commitment can become problematic if the enterprise needs 750 kW later and no adjacent power is available. Expansion rights can therefore have real economic value.
Renewal rights deserve similar attention. Once an enterprise has installed substantial infrastructure, the cost of moving gives the incumbent provider leverage. Renewal pricing and notice periods should be considered before the initial contract is signed.
For larger commitments, the power-utilization schedule can be especially important. Enterprises should understand when take-or-pay obligations begin, whether they ramp in phases and what happens to unused reserved capacity. Cross-connect charges, remote-hands pricing, installation fees and decommissioning terms should also be reviewed as part of the commercial model.
The objective is not to negotiate every line item to the lowest possible price. It is to eliminate future surprises.
Why the Cheapest Colocation Quote May Not Be the Lowest-Cost Solution
Consider two facilities. Facility A offers lower space and power pricing, but the enterprise’s preferred Tier 1 ISP is not on-net. Private cloud connectivity requires transport to another facility, cross connects are expensive and the disaster-recovery environment requires an additional DCI service.
Facility B has a higher base colocation rate, but the required carriers are already present, the cloud on-ramp is local and multiple competing network providers can serve the customer. Facility B may ultimately have the lower TCO.
This example illustrates one of the central principles of colocation procurement:
The facility and connectivity architecture should be priced together.
Illustrative Colocation Cost Models
Exact pricing depends too heavily on the facility and requirement to publish universal retail price ranges responsibly. It is more useful to show how the cost model changes with scale.
Small Enterprise Deployment
A two-cabinet environment might include 10 kW of total power, dual feeds, Internet connectivity, two or more cross connects and some remote hands. In this environment, the cabinet price is only the beginning. The enterprise should calculate an all-in monthly number that includes power, connectivity and operations.
100-kW Enterprise Cage
At 100 kW, the economic model changes. The enterprise may have a private cage, multiple carriers, private cloud connectivity and significantly more cross-connect infrastructure. The important comparison becomes the complete facility-and-network architecture rather than an individual cabinet rate.
500-kW Wholesale Deployment
At 500 kW, published wholesale data becomes more useful. Using a $215/kW primary-market benchmark as an illustrative example:
500 kW × $215 = $107,500 per month
That equals approximately $1.29 million per year before many additional services. A $15/kW pricing difference at 500 kW equals $7,500 per month, or $450,000 over five years before escalators. That is enough money to justify serious sourcing and negotiation. Yet a $15/kW premium may still be rational if it eliminates substantially more expensive transport or migration costs.
Multi-Megawatt AI Deployment
At 5 MW, even a hypothetical $180/kW/month rate produces $900,000 per month, or $10.8 million annually in base facility expense. At that scale, however, the availability date can be worth more than a modest difference in rent. If a major AI deployment is waiting for power or cooling readiness, a six-month delay can have an economic impact that dwarfs a modest facility premium.
How to Compare Colocation Quotes Apples-to-Apples
A useful comparison starts by forcing every proposal into the same model. First normalize the power assumptions. If one provider bundles electricity and another meters it, calculate both at the same expected utilization. Then normalize resiliency so an N+1 design is not compared directly with a materially more resilient architecture without recognizing the difference.
Next, model connectivity. Add the carrier services, cloud access and cross connects actually required by the architecture. Finally, model the entire contract period, including escalators and known one-time costs. A five-year decision should be compared on a five-year basis. Only then does the enterprise have an apples-to-apples TCO.
A Practical Enterprise Decision Framework
A strong colocation decision can be organized around six questions. Capacity: how much power and space are needed today, and how much will be needed later? Market: which geography best aligns users, cloud platforms, data, risk and power availability? Connectivity: which carriers, cloud on-ramps and DCI services are required? Resiliency: which failures must the infrastructure survive? Commercials: what is the normalized total cost over the intended contract term? Operations: who will run and support the environment?
Those questions should be answered before providers are ranked. Otherwise, the enterprise risks selecting the proposal that looks cheapest rather than the architecture that creates the most value.
Common Colocation Pricing Mistakes
The most common pricing mistakes share a theme: they focus on one line item rather than the complete environment. Comparing cabinet rates without normalizing power can produce the wrong answer. Comparing $/kW without determining whether electricity is included can do the same. Ignoring annual escalators understates long-term cost.
Reserving too much capacity can be expensive under take-or-pay structures, while reserving too little can leave an enterprise unable to expand. Selecting the data center first and solving connectivity afterward can add unnecessary carrier and cloud costs. AI buyers face another risk: assuming that high available power automatically means high-density readiness. Rack-level cooling and electrical architecture still need to be validated.
Perhaps the most expensive mistake is failing to consider the end of the contract. A cheap facility can become extremely expensive if unfavorable renewal terms collide with the enormous cost of moving.
The 2027 Data Center Colocation Pricing Outlook
The evidence entering 2027 points toward continued pricing pressure. CBRE reported record-low primary-market vacancy of 1.4% in H1 2026 and more than 80% of under-construction capacity already preleased.
JLL’s broader North American dataset reports vacancy near 1% and expects it to remain near zero through 2028. JLL also reports that most tenants securing space today are contracting for 2028 deliveries.
No forecast is certain, but several trends appear durable: power availability should continue to influence pricing more than floor space; high-density AI-ready capacity should retain pricing leverage; more large-scale compute development should move toward emerging power-rich markets; and enterprise buyers requiring substantial capacity will need to begin sourcing earlier than they did historically.
For larger deployments, the most important pricing question in 2027 may increasingly be: what does available capacity cost when we actually need it?
Frequently Asked Questions About Data Center Colocation Pricing
How much does data center colocation cost in 2027?
There is no single national price. Cost depends on deployment size, market, power density, resiliency, connectivity, cooling and contract structure. Small deployments are commonly priced per cabinet, while larger requirements increasingly use $/kW/month.
How much does one colocation rack cost?
Rack pricing depends heavily on how much power is included. A rack price without the associated kW allocation, redundancy and service bundle is not a useful comparison.
What does $/kW/month mean?
It is a common capacity-pricing metric for larger deployments. A 500-kW commitment at $200/kW/month produces a base monthly cost of approximately $100,000.
Is electricity included?
It depends on the contract. Some providers bundle power and electricity while others charge capacity plus metered utility consumption.
What is take-or-pay power?
A take-or-pay provision requires a tenant to pay for a minimum portion of reserved power even if the actual load is lower.
Is wholesale colocation cheaper than retail?
Wholesale deployments generally have lower unit costs, but the tenant commits to much more capacity and usually a longer contract.
Which U.S. market has the lowest colocation pricing?
There is no universally cheapest market. Pricing varies by requirement and availability. Dallas and several emerging markets can offer attractive economics, while Silicon Valley, Chicago and New York/New Jersey tend to be more expensive for strategic and supply-related reasons.
Why is AI colocation more expensive?
AI environments can require substantially higher rack densities, liquid cooling, specialized electrical infrastructure and greater network capacity. Not every conventional data center can support those requirements.
Are cross connects normally included?
Usually not. Cross connects commonly carry both installation and recurring monthly charges.
How far in advance should an enterprise source colocation?
Small retail requirements may be available relatively quickly. Large power commitments can require much longer lead times, and in current tight markets some large tenants are contracting years ahead of their required service dates.
Is the cheapest provider the best value?
Not necessarily. The correct comparison is total cost of ownership, including power, connectivity, resiliency, operations, escalators and migration risk.
Data Center Colocation Pricing in 2027: The Bottom Line
Colocation is becoming less like renting technical real estate and more like securing access to a scarce infrastructure platform. The most valuable resource is increasingly power, but power alone is not enough. The facility also needs to deliver the required cooling, carrier ecosystem, cloud connectivity, resiliency and operational model.
That is why comparing colocation prices requires much more than looking at cabinet rates or $/kW. The enterprise should start with the workload, determine its power and density requirements, map its network dependencies and define the level of resiliency the business actually needs. Only then should facilities and providers be compared.
The goal is not to find the cheapest data center. It is to identify the facility and network architecture that provides the best long-term economic platform for the business.
Planning a Colocation Deployment, Expansion or Renewal?
Macronet Services helps enterprises evaluate colocation, carrier connectivity, cloud access and network architecture together. For organizations considering a new data center, negotiating an existing renewal or evaluating multiple markets, Macronet Services can help compare providers, normalize pricing, assess connectivity requirements and evaluate the true cost of the infrastructure architecture.
Before committing to a facility or renewing an existing agreement, make sure the pricing model reflects the complete infrastructure architecture—not just the rack or $/kW quote.